Stop Guessing Why Customers Hang Up. Start Watching the Call Journey.
Traditional Teams Phone reports show what happened. TeamsCX shows the full customer journey behind every call. From IVR selections and queue wait times to transfers, holds, and agent interactions, call journey visualization reveals exactly where customer experiences break down. Teams can identify bottlenecks, improve routing, resolve complaints faster, and optimize service operations using real evidence from every interaction.
Your Teams Phone reports tell you what happened. They don't tell you why.
You can see that the call lasted 4 minutes 12 seconds. You can see it was answered. You can see the agent's name. What you can't see is that the customer waited 38 seconds in queue, got bounced between two departments, sat on hold for 47 seconds while the second agent searched for context they didn't have, and finally hung up sounding polite but never came back.
That's the gap between a "successful" call on a dashboard and an actual customer experience. And it's the gap call journey visualization was built to close.
The problem: you're managing a black box
Most Teams Phone operations measure calls the way airlines measure flights — departure time, arrival time, duration. Useful, but it tells you nothing about whether the seat was broken or the meal was cold.
When a manager asks "why did our CSAT drop last week?", the standard reporting stack offers a few familiar metrics: total calls, average handle time, abandonment rate, and service level percentage. These are outcomes. They're scoreboards, not playbooks. By the time the numbers shift, the damage is already done — and you still don't know which part of the experience caused it.
What gets missed in the gap
Behind every "answered" call there's a sequence of events: the IVR menu the caller navigated, the queues they sat in, the transfers, the hold music, the failed callbacks, the moment they were finally connected to a human who could help. Each of those steps is a chance for the experience to break. And in most reporting tools, those steps don't exist as a single, viewable story. They're scattered across separate logs — if they're captured at all.
Industry research consistently points to the same uncomfortable truth: the majority of customer frustration originates from transfer and hold experiences, not from the final agent interaction. Yet that's exactly where most reporting goes dark.
The shift: see the call the way the customer experienced it
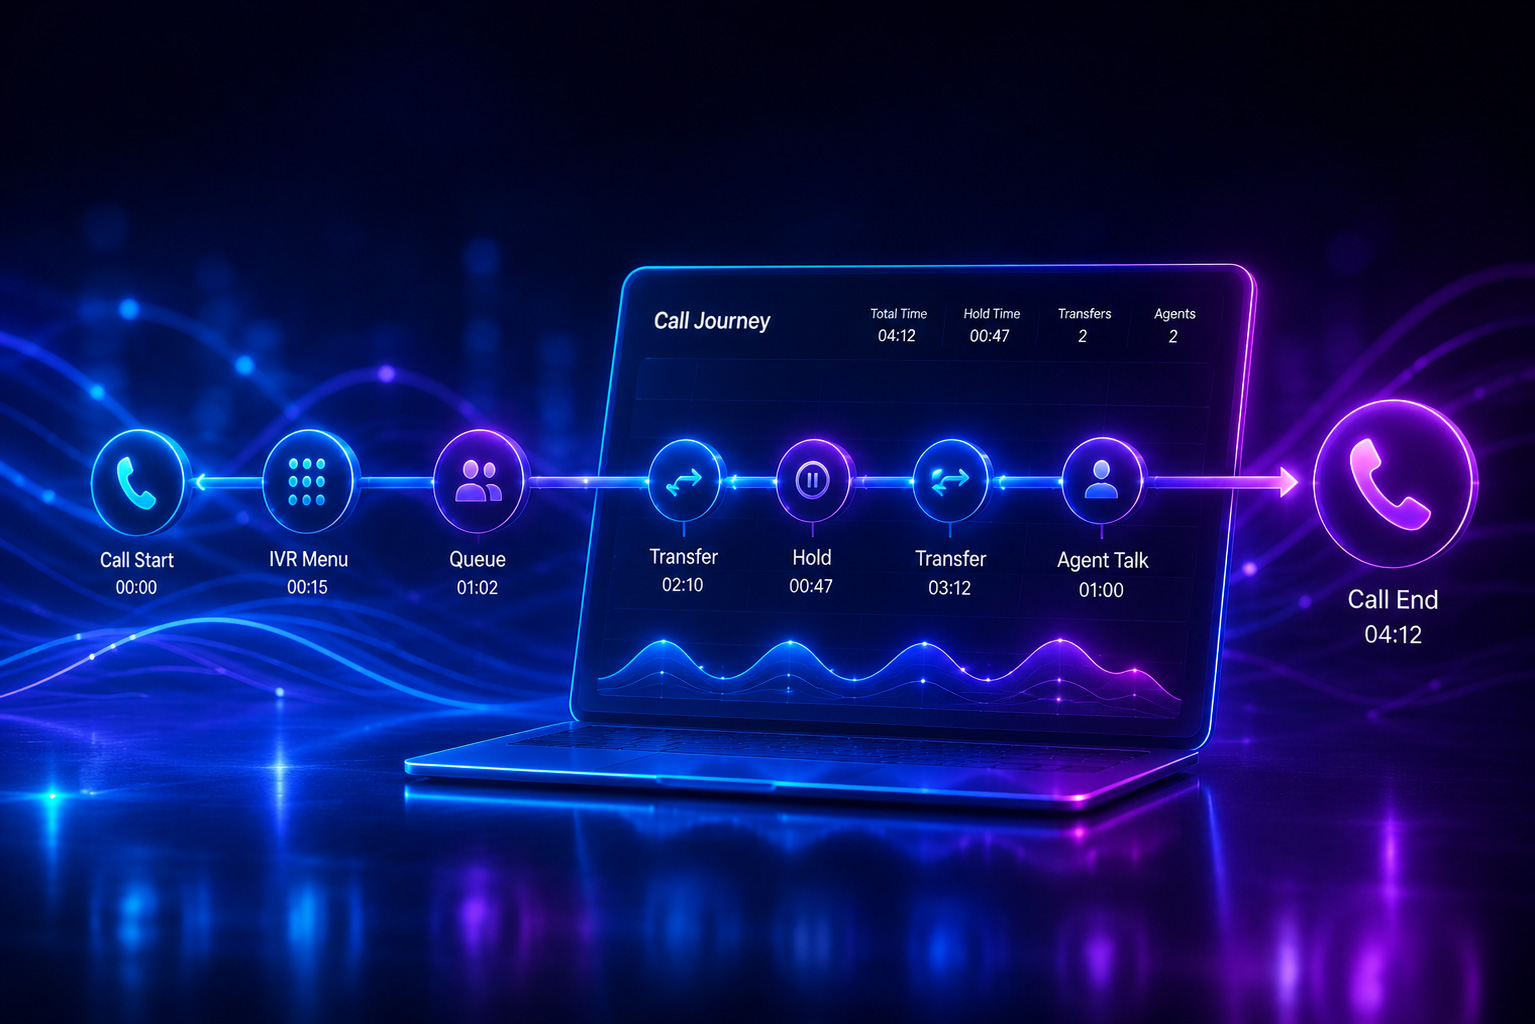
Call journey visualization is exactly what it sounds like: a complete timeline of a call from the initial attempt to reach the callee to the moment the call is terminated. Every ring, every IVR selection, every queue entry, every transfer, every hold, every agent involved — laid out in order, with timestamps.
It turns a call from a row in a spreadsheet into a story you can read.
What you actually see
When you open the call journey for a single interaction inside TeamsCX, you get the full sequence:
- The moment the call entered your system
- How long it spent in the IVR, and which options the caller picked
- Which queue it landed in, and how long it waited there
- Every agent it touched, and what they did with it
- Hold time, transfer time, talk time, broken into segments
Suddenly, "the customer hung up" stops being a mystery. You can see the 1-minute-22-second hold that preceded it.
-
What managers do with it that they couldn't do before
This is where the shift matters. Call journey visualization isn't a nicer chart — it changes what's actionable in customer service operations.
Coach on patterns, not anecdotes
Instead of telling a supervisor "your team's transfer rate is high", you can show them ten call journeys where the same misrouting happened, point to the IVR branch that's sending the wrong calls to the wrong queue, and fix it on Monday. Coaching becomes evidence-based instead of opinion-based.
Diagnose service drops in minutes, not weeks
When a service-level number dips, you don't run a two-week investigation. You open the journeys for the calls that breached SLA, look at the pattern across the timelines, and locate the bottleneck — a specific queue, a specific time of day, a specific transfer chain.
Resolve customer complaints with the receipts
A customer calls to complain. Instead of saying "let me look into it", you pull up the journey of their original call, see the three transfers and the two-minute hold, and lead the conversation with "I can see exactly what went wrong, and here's what we're doing about it." Trust restored in 30 seconds.
Make the IVR earn its place
Every IVR menu has a hypothesis baked into it: callers will pick the option that fits their need. Call journeys show you, at scale, whether that hypothesis holds. If 40% of the calls that land in "Billing" had to be transferred out, your IVR is the problem, not your agents.
Why this is hard to get from Teams Phone alone
Microsoft Teams Phone is a strong telephony platform. It is not, by design, a customer experience analytics platform. The native reporting gives you call records, not call narratives — and reconstructing a journey by hand from raw logs is a job no manager has time to do.
That's the layer TeamsCX adds. Real-time telemetry plus the full call journey for every call, sitting directly inside Teams, where your team already works. No data exports, no separate dashboard tab to forget about, no two-day lag.
The bottom line
Customer service quality doesn't improve when you stare harder at average handle time. It improves when you can see, for any specific call, exactly what the customer went through — and when patterns across thousands of those journeys tell you where to intervene.
Call journey visualization is how you move from running a call center by averages to running it by evidence.


